$ 操作符是一种语法糖,用于查询和设置边序列中边的属性。
用法
# S3 method for class 'igraph.es'
x[[i]] <- value

# S3 method for class 'igraph.es'
x[i] <- value

# S3 method for class 'igraph.es'
x$name

# S3 method for class 'igraph.es'
x$name <- value

E(x, path = NULL, P = NULL, directed = NULL) <- value详细信息
$ 的查询形式是 edge_attr() 的快捷方式,例如 E(g)[idx]$attr 等同于 edge_attr(g, attr, E(g)[idx])。
$ 的赋值形式是 set_edge_attr() 的快捷方式,例如 E(g)[idx]$attr <- value 等同于 g <- set_edge_attr(g, attr, E(g)[idx], value)。
参见
其他顶点和边序列:E(), V(), as_ids(), igraph-es-indexing, igraph-es-indexing2, igraph-vs-attributes, igraph-vs-indexing, igraph-vs-indexing2, print.igraph.es(), print.igraph.vs()
示例
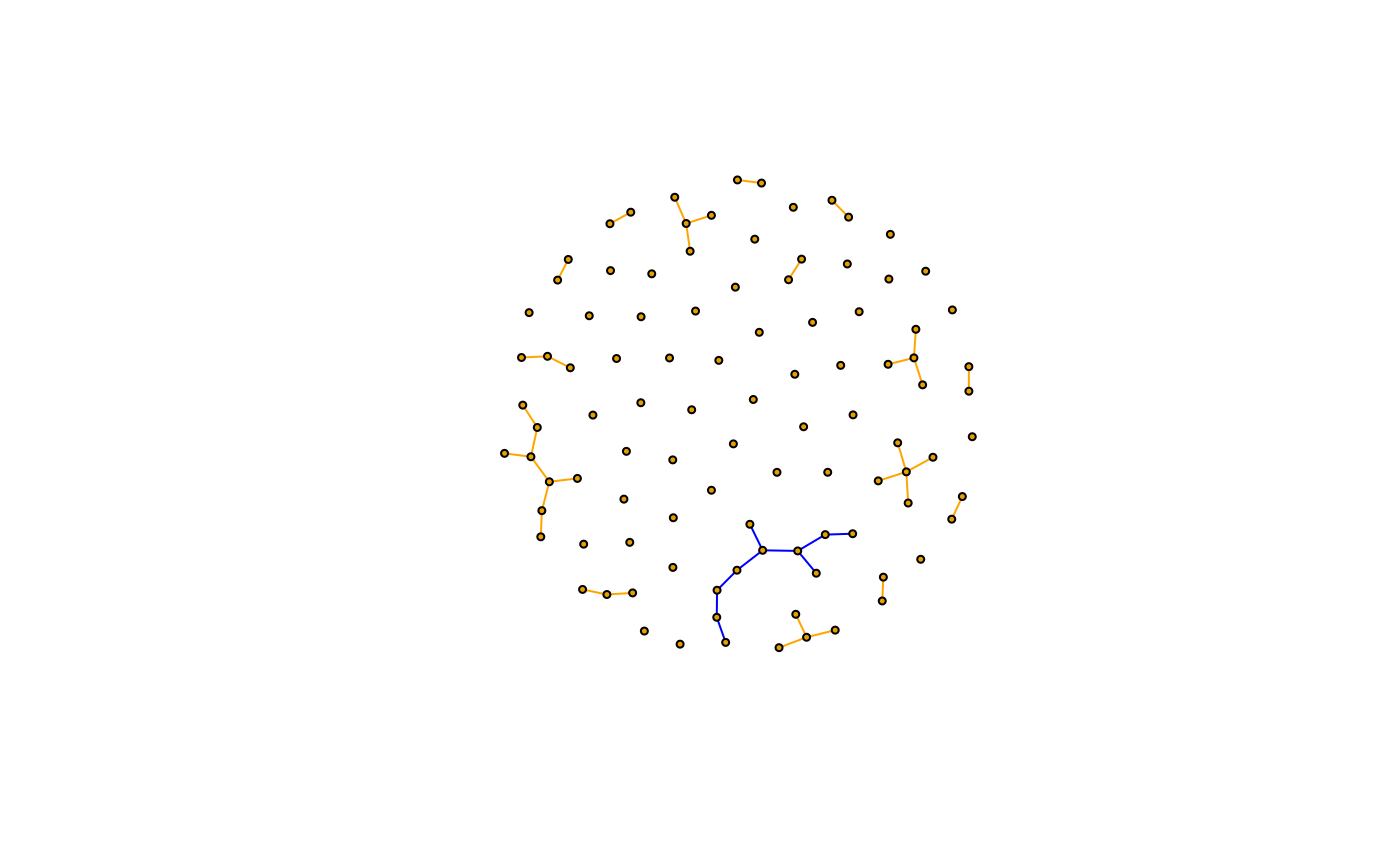
# color edges of the largest component
largest_comp <- function(graph) {
  cl <- components(graph)
  V(graph)[which.max(cl$csize) == cl$membership]
}
g <- sample_(
  gnp(100, 1 / 100),
  with_vertex_(size = 3, label = ""),
  with_graph_(layout = layout_with_fr)
)
giant_v <- largest_comp(g)
E(g)$color <- "orange"
E(g)[giant_v %--% giant_v]$color <- "blue"
plot(g)