将多个图放置在同一布局上
用法
merge_coords(graphs, layouts, method = "dla")

layout_components(graph, layout = layout_with_kk, ...)详细信息
merge_coords() 接收一个图列表和一个坐标列表,并将这些图放置在一个共同的布局中。使用 method 参数选择使用的方法,但目前只实现了 dla 方法。
dla 方法用圆圈覆盖图。然后,它首先根据顶点数量对图进行排序,并将最大的图放置在布局的中心。然后,其他图以递减的顺序通过 DLA(扩散限制聚集)算法放置:该图随机放置在一个远离中心的圆圈上,并进行随机游走,直到该图走入已放置的较大图中,或走得离布局中心太远。
layout_components() 函数首先将图分解为最大的连通分量,并为每个分量单独调用提供的 layout 函数。最后,它通过调用 merge_coords() 合并布局。
参见
plot.igraph(), tkplot(), layout(), disjoint_union()
其他图布局:add_layout_(), component_wise(), layout_(), layout_as_bipartite(), layout_as_star(), layout_as_tree(), layout_in_circle(), layout_nicely(), layout_on_grid(), layout_on_sphere(), layout_randomly(), layout_with_dh(), layout_with_fr(), layout_with_gem(), layout_with_graphopt(), layout_with_kk(), layout_with_lgl(), layout_with_mds(), layout_with_sugiyama(), norm_coords(), normalize()
作者
Gabor Csardi csardi.gabor@gmail.com
示例
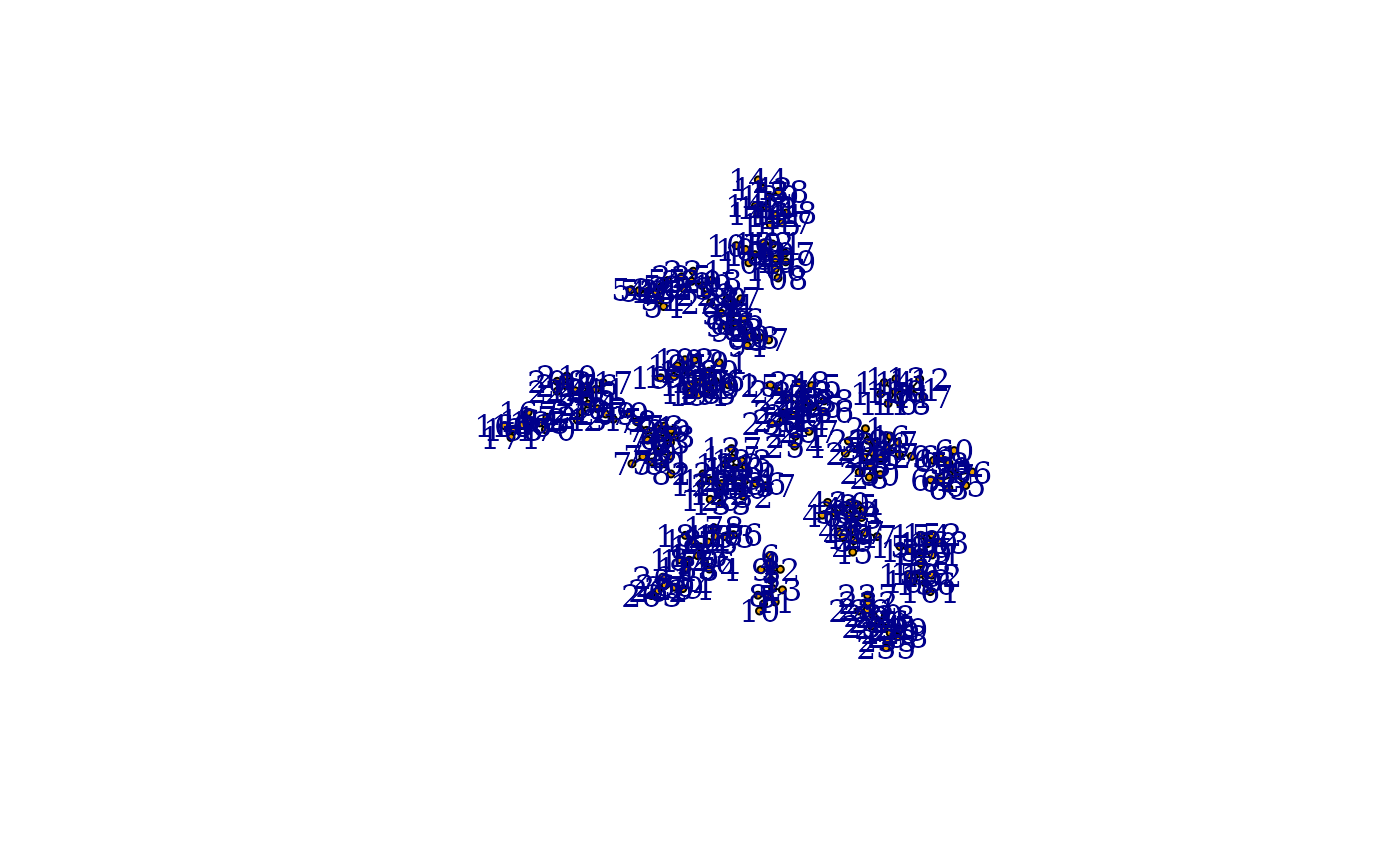
# create 20 scale-free graphs and place them in a common layout
graphs <- lapply(sample(5:20, 20, replace = TRUE),
  barabasi.game,
  directed = FALSE
)
layouts <- lapply(graphs, layout_with_kk)
lay <- merge_coords(graphs, layouts)
g <- disjoint_union(graphs)
plot(g, layout = lay, vertex.size = 3, labels = NA, edge.color = "black")